
Compiled using data publicly available from the Office for National Statistics and HM Customs and Revenue, FIRA’s latest statistical digest is one of the most reliable records available of today’s industry, covering its sub-sectors across a range of contract, office and domestic product groups.
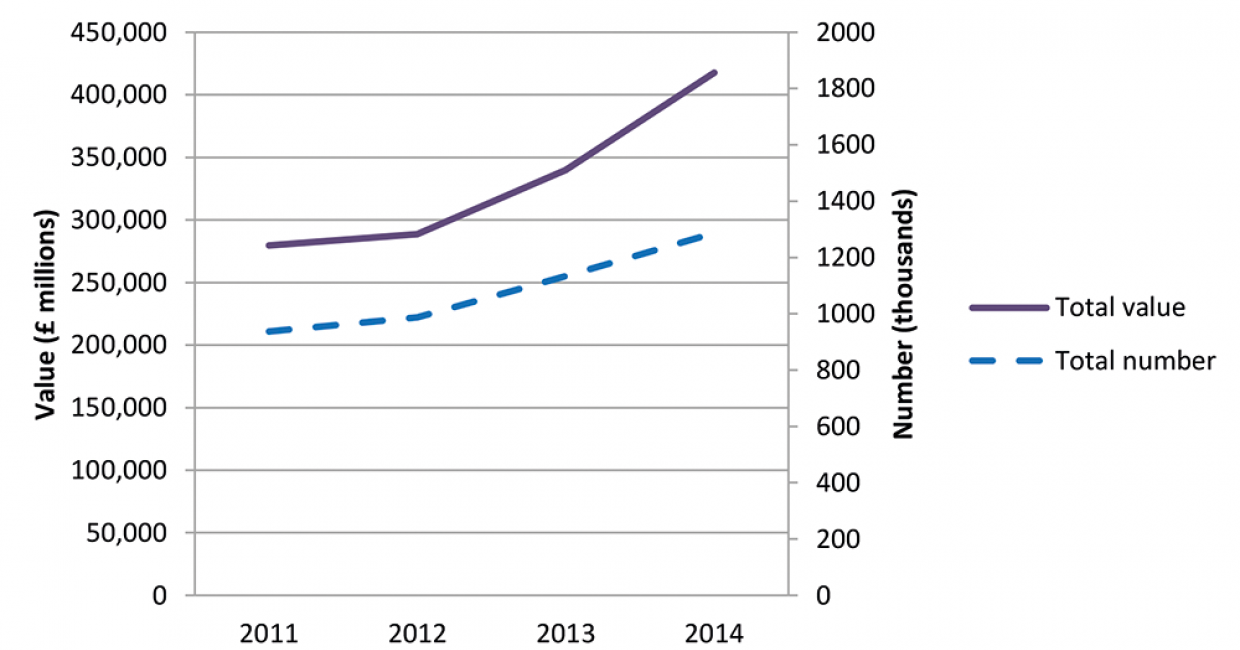
Consumer expenditure on furniture and furnishings was almost £14b in 2014 – an 8% increase from 2011, fuelled by significant growth in 2014 which was 7% greater than 2013.
Furniture and furnishings repair spend, having reached £59m in 2012 – a significant recovery after a very tough year in 2010 – dropped to just £23m in 2014. However, although anecdotal evidence suggests otherwise, the true value may be hidden within other statistics.
The average weekly retail internet sales for all products grew to £719m in 2014. As such, in December 2014 the internet accounted for almost 12.8% of all retail sales, compared with 11.8% in the same month the previous year. Comparable values in the household goods sector were much smaller – only 5% of all internet sales are attributable to the sector (2% for furniture and furnishings).
Turnover
Total provisional turnover for all UK furniture manufacturing in 2014 was £7.4b – 6.1% higher than in 2013, and 14.6% higher than in 2011. This represents a significant recovery, with the largest increases occurring in 2013 and 2014. Furniture manufacturing in 2014 represented 1.4% of the UK’s total manufacturing turnover.
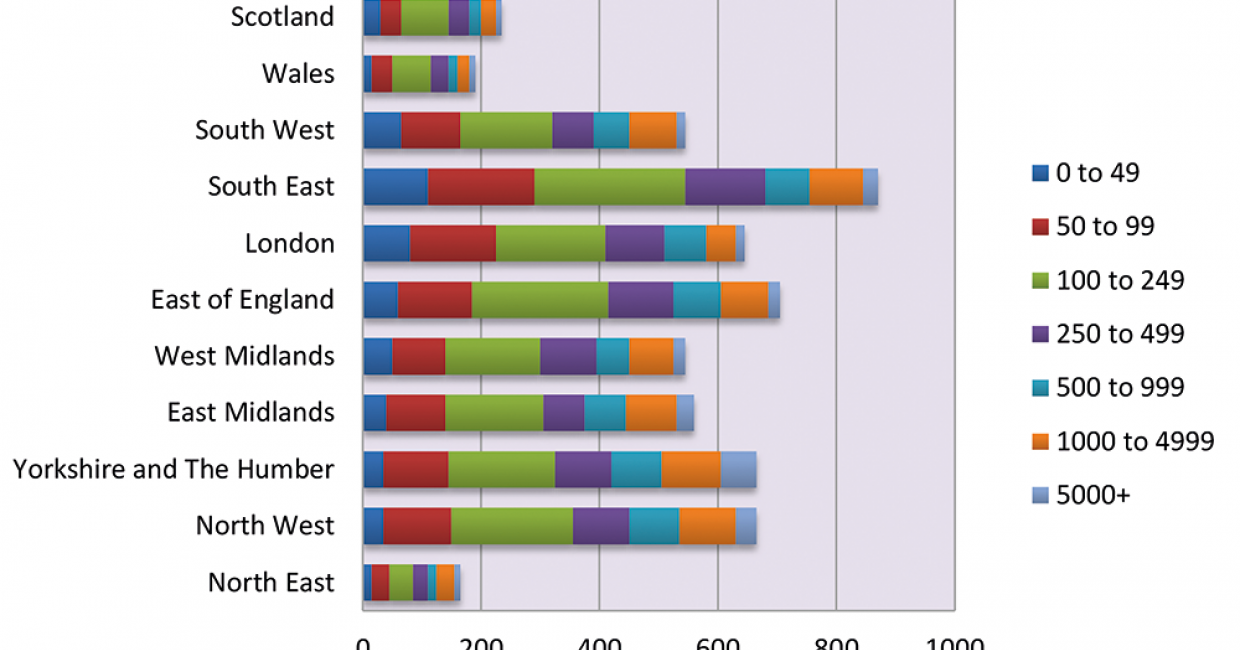
The total number of furniture manufacturers in 2014 was 5932. This number has gradually declined since 2011 (by 3.2%), with the most notable decrease occurring in 2012/13 (1.9%).
Despite 2014 turnover being 1.4% of the total for UK manufacturing, the furniture sector employed 2.9% of all UK manufacturing personnel (71,000). This is estimated to have equated to 2.4% of the UK manufacturing wage bill. The number of employees appeared, against general employment trends, to have dropped significantly from 2013 to 2014. This may not be the true position due to the provisional nature of the data – the 83,000 figure for 2013 may be a better reflection of the situation.
There has been a 6% increase in office and shop furniture manufacturing turnover since 2011. Whilst 2014 turnover was estimated to be just over £2b, there was no increase in value compared with the previous year.
Kitchen furniture manufacturing turnover had historically fallen significantly, from a high of £1.7b in 2008 to a low of £1.1b in 2011. After a couple of years of comparatively poor performance the corner appears to have been turned – turnover in 2014 increased to £1.7b, matching the sector’s 2008 high. This represents a 50% increase since 2011 and a 22% increase over the previous year.
Sub-sectors
The mattress sub-sector has tended to be relatively stable compared with its counterparts, but over recent years has exhibited substantial growth. Manufacturing turnover has continued to increase since 2011, reaching £0.66b in 2014, a 29% increase over the period. The majority of this increase (20%) occurred between 2011 and 2013, although 2014 still saw a very healthy 7.1% increase over the previous year.
Other furniture, which comprises all items not previously mentioned, plus parts, has grown less significantly. 2013 saw a slight recovery to £2.92b, and this recovery continued into 2014 when turnover reached £2.99b (a 2.5% increase on the previous year).
Imports
In 2014, imports rose to £4.8b from £4.6b the previous year, representing 47% of the home market. This home market, based on UK manufacturing sales, export and import data, was estimated to be £10.2b.
Annual imports are predicted to be close to the £5b mark by the end of 2015.
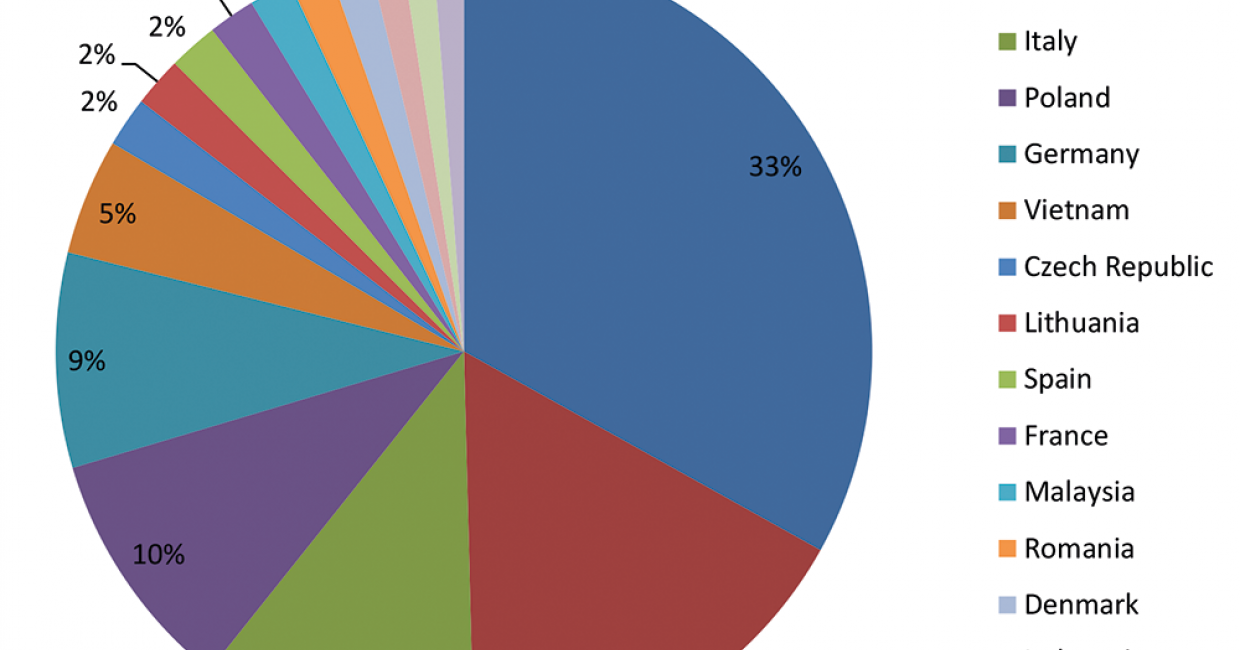
The majority of imports (almost £1.6b) originated from China, and its share of this market, having dropped slightly to 32% in 2013, recovered to 33% in 2014.
Italy remained the second largest exporter of furniture to the UK, with its share of the import market remaining at 11%. Poland overhauled Germany in the league table and supplied 10% of all imports (Germany supplied 9%).
Other changes in the hierarchy saw the Czech Republic, Lithuania and Spain leapfrog France, and Brazil and Portugal appeared in the top 15 for the first time, at the expense of Sweden and Slovakia.
Imports from the US appear to have fallen dramatically, from £141m in 2013 to £55m in 2014.
Exports
Furniture exports have remained relatively static since 2011, although the provisional £930m figure for 2014 is an improvement of 10% on the previous year. Initial indications for 2015 suggest that this improvement in export performance may not be sustained, and could fall back to about £867m.
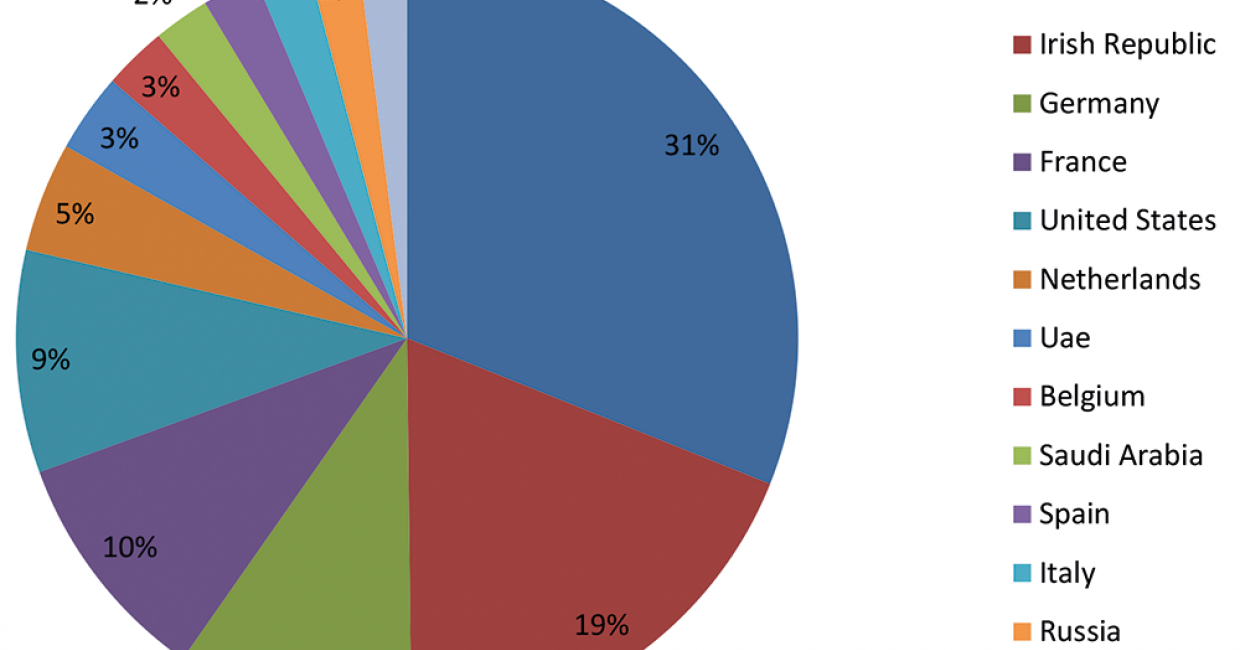
The UK export market traditionally targets the Republic of Ireland and the US, although in 2014 France and Germany both received 10% of UK exports, and the US only 9%. The figure for the Republic of Ireland was 19%, compared with 17% the previous year, and equating to £166m.
Exports to the EC totalled £531m in 2014 – an increase of £21m. Exports to the UAE, having grown in value the previous year, fell from £38m to £30m, and Russia – as might be expected due to its current economic position – only received £19m worth of furniture. As a result, like China, it dropped out of the top 10 export destinations.
Trade gaps
The negative trade gap continued to widen, with increases in imports outstripping any small increases in exports. It reached £3.84b in 2014, and could exceed £4b by the end of 2015. The negative trade gap with China, the largest for the sector, increased to £1.57b.
The main positive trade gap – as in previous years – was with the Republic of Ireland, which increased from £122m in 2014 to £141m in 2014.
After this, there was a number of countries with which the UK benefited from much smaller positive trade gaps in 2014, starting with the US at £31m, and followed by the UAE at £22m (although this was at £30m the previous year).
In 2013 it was noted that the trade gap with the US became negative for the first time in a number of years. The position, due to a decrease in imports from this country, has been reversed, and there was a positive trade surplus in 2014 of £31m.
The full report is available free to FIRA members, and for £300 otherwise. The contents of the report are believed to be correct at the time of publication, but cannot be guaranteed.
THE AUTHOR
Dr Peter Beele is the technical development manager at FIRA International, a company that delivers independent services dedicated to the furniture supply chain and consumers, as well as research and standards advice for members of the Furniture Industry Research Association.


