

FIRA’s latest statistical digest provides a summary of how the UK furniture industry performed to the end of 2015, inspecting data from Government bodies such as the Office for National Statistics, HM Customs and Revenue and Communities and Local Government to identify the sector’s underlying manufacturing and spending trends.
Published in November last year, the report covers 2012-15, and includes some estimates for 2016. Although the timeframe is limited to publicly-available data, FIRA’s digest provides one of the clearest pictures of the industry available.
Covering areas such as national economic trends, the structure of the UK furniture manufacturing industry and trading relationships with the rest of the world, the report delivers figures across contract, office and domestic subsectors.

THE AUTHOR
Dr Peter Beele is the technical development manager at furniture testing and research body FIRA.
The full report is available free to FIRA members, and for £1000 otherwise.
KEY FINDING OF THE REPORT INCLUDE:
National economic trends
* At the end of 2008 total net unsecured lending, having increased on a regular basis over previous years, started to fall, bottoming out at £207,092m in June 2012. Since then it has increased with lending at the end of 2015 being 9.3% higher than at the end of 2014.
* Some of this increase in lending was attributable to credit cards (3.9% from 2014 to 2015) although this was significantly smaller than the increase of 7.4% from 2013 to 2014.
* Total outstanding lending, including that secured by individuals and housing associations on dwellings, peaked at £1548b in 2015. This was 3.5% higher at the end of 2015 than at the end of 2014.
* This greater rate of increase in total lending has been driven by lending secured on dwellings which increased by 2.4% from the end of 2014 to the end of 2015, whereas in the previous year the increase was only 1.5%.
* At the end of 2015 lending secured on dwellings reached £1285b and preliminary data for 2016 show that this figure increased to £1305b by June of that year.
* The number of dwellings starts in the UK almost halved between 2007/8 and 2008/9. Since then they had continued to increase gradually, but over the period 2011 to 2013 starts fell by over 10,000 compared with 2010/11. This decline reversed significantly in 2013/14 with starts increasing by 35,090 (28%) compared with the previous year. Starts in 2014/15 reached 171,850. However, this was only an increase of 9750, which equated to a 6% increase on the previous year.
“One of the Government’s drivers for 2017 is the continued revival of the new homes market, including support for a significant number of affordable homes,” comments the digest’s author, Dr Peter Beele. “It is not my main area of expertise, and the experts appear to be divided, with some feeling the uncertainty around Brexit will slow the market and others feeling that buyers may take advantage of continued low interest rates. No-one seems to know for sure
“The Telegraph suggested that the housing market in 2016 fluctuated and was not as buoyant as might have been expected, and it is anticipated that, while housing has rebounded more strongly than expected after the Brexit referendum, the level of transactions has dropped, and growth in 2017 may be notably slower than in 2016. Others have higher hopes for the next 12 months, as the market adjusts to the ‘new normal’ and buyers take advantage of low interest rates.”
* The total number of property transactions above £40,000 reached 1.3m. However, the increase from 2014 to 2015 was considerably smaller (0.7%) than the YoY increases for the previous two years, which were just under 14%.
“There has been greater consumer demand, as indicated by the retail figures. In addition, there has been renewed commercial development over the last few years”
Total consumer expenditure in the UK increased between 2012 and 2015 to £1136b (just over a 7% increase). The most significant growth in expenditure over this period occurred in net tourism at 53%, followed by clothing and footwear, which increased by 16%.
* Expenditure on furnishings, household goods and house maintenance increased from 2012 to 2015 by 14%, with the majority of this growth attributable to the period 2014 to 2015, where increase in expenditure over the year was 6%.
* Consumer expenditure on furniture and furnishings was £16.2b in 2015 and exceeded all other spend in the furnishings, household goods and house maintenance sector. This represented a 33% increase from 2012, with consistent YoY growth at between 9% and 12%.
* Furniture and furnishings retail sales in 2016 have continued to increase, with first and second quarter consumer expenditures being respectively 3.6% and 2.4% higher than for the equivalent periods in 2015.
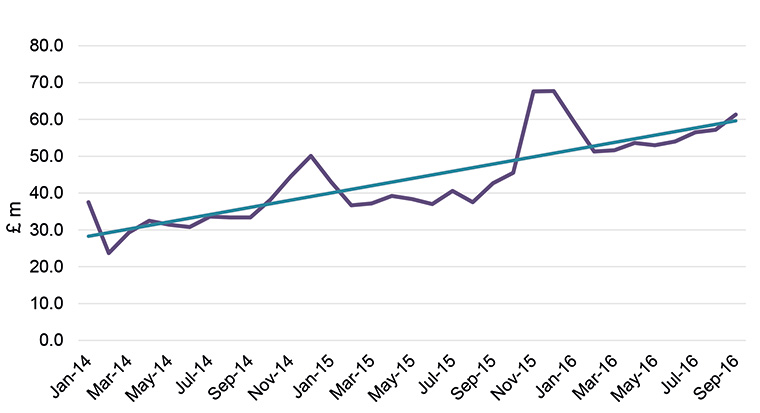
Average weekly internet sales for household goods, 2014-2016, sourced from the ONS (not seasonally adjusted)
* Household textiles expenditure also exhibited a massive increase from 2012 to 2015 (37%), followed by small electric household appliances at 27%.
* The greatest reductions in expenditure from 2012 to 2015 were in furniture and furnishings repair (58%) and carpets and floorcoverings (18%).
* Within the retail sector furniture and furnishings repair spend having reached £59m in 2012 – which represented a significant recovery after a very tough year in 2010 – dropped to only £25m in 2015, although anecdotal evidence suggests otherwise and the true value may be hidden within other statistics.
* The household goods sector has seen a marked increase in internet sales, with YoY growth in September 2016 equating to 44.4% (compared with September 2015). This value of £61.3m per week equates to 10.4% of retail sales in the sector and 6.6% of UK retail sales in total.
Furniture industry trends
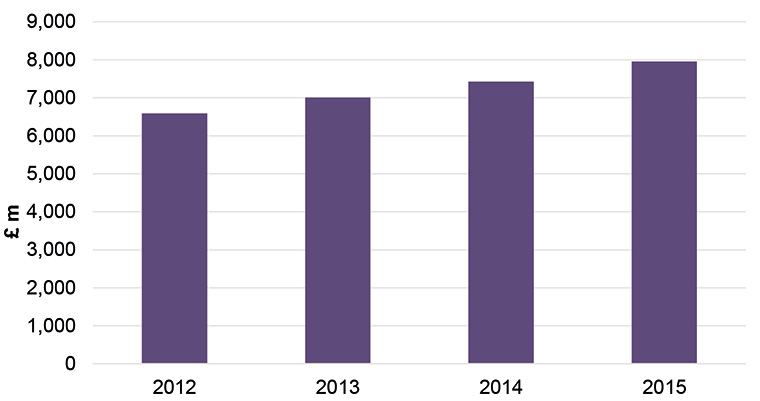
Turnover of UK furniture manufacturers, 2012-2015
* Total provisional furniture manufacturing turnover in 2015 was just under £8b, which was 7.1% higher than the previous year and 20.8% higher than in 2012.
* Furniture manufacturing in 2012 equated to 1.28% of the UK’s total manufacturing turnover, whereas in 2015 this had increased to 1.55%.
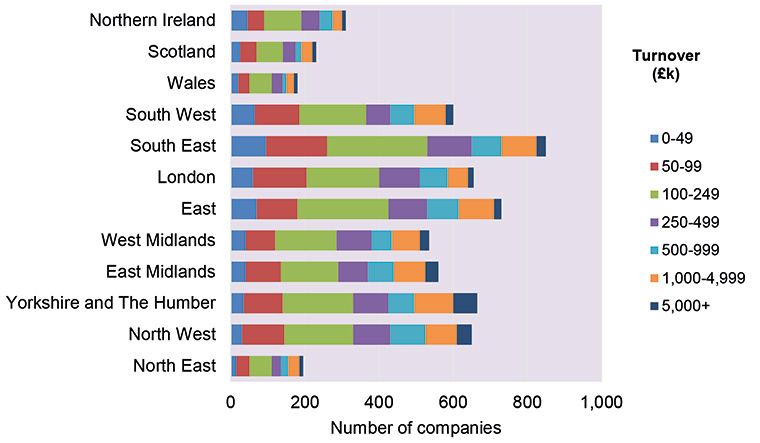
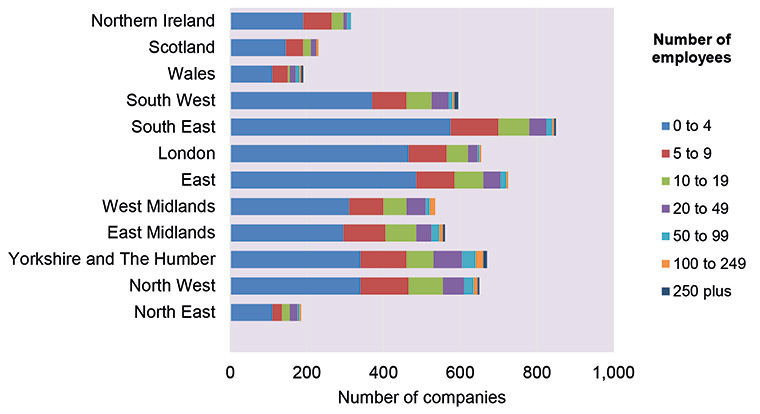
Number of furniture manufacturers in turnover bands by region, sourced from the ONS
On the surface the reason for this change is quite simple – there has been greater consumer demand, as indicated by the retail figures,” says Peter. “In addition, there has been renewed commercial development over the last few years. However, I am not privy to what makes the consumer to decide to spend, and spend on furniture.
“Consumer lending was relatively static for a few years, but more recently has increased YoY. Clearly they felt confident enough to borrow to purchase items (such as furniture, which tends to be sold via credit agreements). Also, remember that much of this data is from 2015 (pre-Brexit vote).
“Having said that, predictions for 2016’s results suggest another increase in furniture manufacturer turnover – possibly by as much as 6 or 7%, but I wouldn’t bet my mortgage on this until firmer data is released mid-way through 2017. “
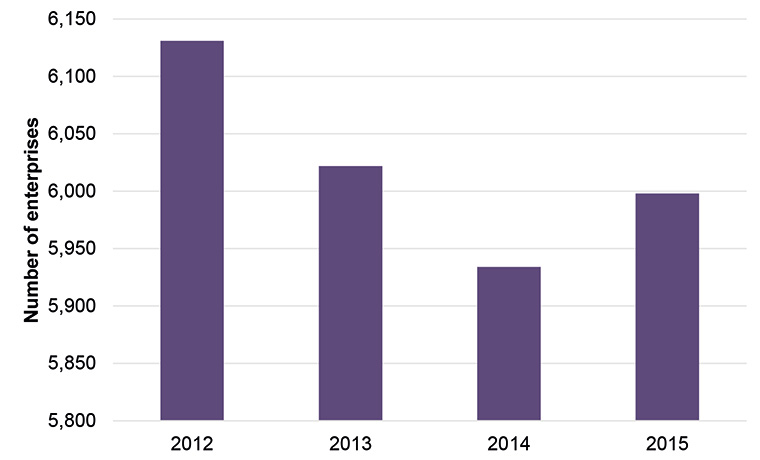
Above: Number of UK furniture manufacturing enterprises, 2012-2015
Below: Average employment in UK furniture manufacturing, 2012-2015
* The total number of registered furniture manufacturers in 2015 was 5998.
* Provisional data for UK furniture manufacturing indicates a 7% decrease in average employment numbers from 2012 to 2015 (86,000 to 80,000).
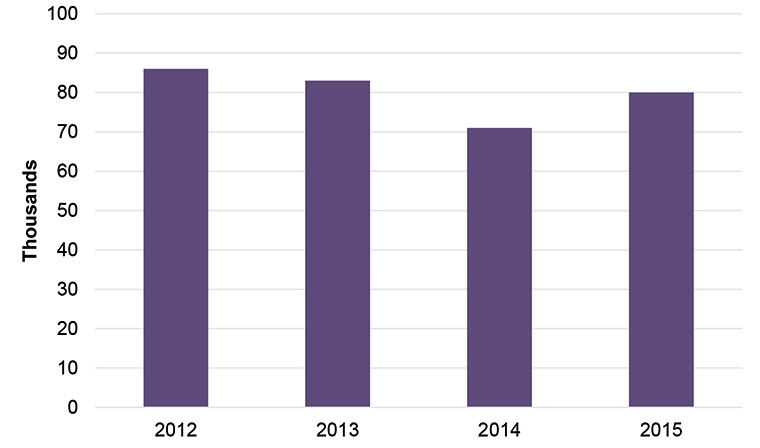
Average employment in UK furniture manufacturing, 2012-2015
“The employment figures are less reliable than they used to be,” Peter clarifies. “There are indications that net CAPEX for the sector has increased over recent years, which might suggest investment in plant and machinery, but I don’t know whether automation is a major contributory factor to this decrease – this would require a much more in-depth analysis.
“There are other, simpler reasons for increased turnover with fewer employees too, such as price increases.”
* Despite 2015 turnover being valued at almost 1.3% of the total for UK manufacturing, the furniture sector employed 3.2% of all UK manufacturing personnel, which is estimated to have equated to 2.4% of the UK manufacturing wage bill.
* The office and shop furniture sector (predominantly contract) saw an 18% increase in turnover from 2012 to 2015, reaching £2.3b.
* Turnover in the kitchen sector having fallen from a high of £1.7b in 2008 to a low of £1.1b in 2011 has since recovered. It increased to £1.6b in 2015, although these provisional estimates suggest a drop of 5% compared with the previous year.
* The mattress subsector has historically been relatively stable compared to its counterparts, but over recent years has exhibited substantial growth. Turnover went from £0.56b in 2012 to £0.75b in 2015 (33% increase), with an increase of 13% from 2014 to 2015.
“Mattress imports as a percentage of the home markets are comparatively low (12% in 2015, dropping from 13% in 2014), which shows that UK manufacturers have a good grip on the market,” comments Peter. “Perhaps the recent NBF campaigns to ensure that its members follow an audited Code of Practice is finding traction with retailers and distributors.
* The ‘other furniture’ subsector accounts for 47% of the industry’s total turnover and, as such, has a large influence on the overall performance figures for the whole sector. Any recovery in turnover here tends to reflect the overall position for the sector.
* Time series data indicates that in recent years 2010 was the best year for the ‘other furniture’ subsector in terms of turnover, peaking at £3.4b. However, over subsequent years, turnover continued to decrease, dropping to a low of £2.9b in 2012. Since 2012 there has been a slow recovery and in 2015 turnover reached £3.3b, which represented a 14% increase over that period. More recently, from 2014 to 2015, there was a provisional 9% increase in turnover, which was the most significant YoY growth for some time.
* The retail figure for furniture and furnishings repair was £25m in 2015 which reflected a continued reduction in consumer expenditure since 2012. However, this doesn’t mirror manufacturing data for furniture and furnishings repair which show that, since 2012, turnover increased YoY up to £193m in 2014. Unfortunately, preliminary data for 2015 indicated a turnover reduction back to £165m.
* The industry continues to be dominated by micro and small- to medium-sized businesses, with only 285 companies (4.6%) operating at turnovers in excess of £5m. 130 companies turned over more than £10m in 2016. These numbers are slightly higher than the previous year, which indicates that some of the larger companies have continued to grow.
“In fact, there has been growth in the number of companies within each turnover category above and including £500,000 to £1m, which is another indicator that growth in manufacturing turnover is attributable to the development of existing companies rather than new entrants into the market.
* 82.5% of companies turned over less than £1m and the largest percentage of companies was in the £100k-£250k turnover band (30.4%).
* In the office and shop sector the number of smaller companies was lower than for the other sectors, with 66.9% of companies turning over less than £1m, and in the ‘other furniture’ sector it was slightly higher at 86.7%.
* The mattress sector was significantly different as it had proportionately more large organisations, with only 48.3% of companies turning over less than £1m.
* There was a significant proportion of extremely small companies within the sector, with 56.8% of organisations operating at turnovers of less than £250,000 (comprising 25 fewer companies than the previous year).
International trade
* Imports of furniture into the UK in 2015 increased to almost £5.4b compared with the previous year’s figure of £4.8b. The prediction for 2016, based on October 2016 trade data to date, is that this figure could reach £5.8b.
* The majority of these imports originated from China (£1.8b), its share being 33% of all furniture received into the UK.
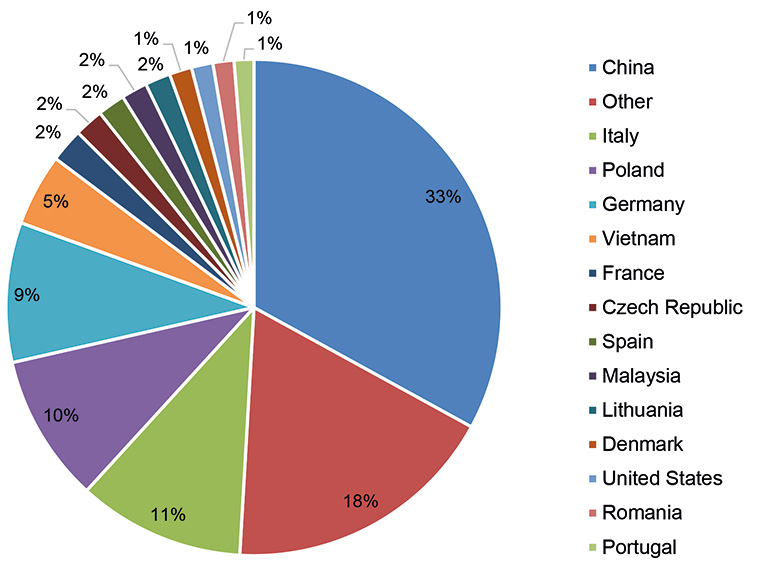
2015 furniture imports into the UK
* Italy remained the second largest 2015 furniture exporter to the UK, with its share of total imports into the UK remaining at 11%.
* The value of 2015 imports from the EC was £2.6b, an increase on the previous year when it was £2.3b.
2015 furniture exports from the UK
* Data shows that furniture exports have gradually increased in recent years (with some minor fluctuations) from £830m in 2012 to £1b in 2015. This figure for 2015 is an improvement of 7% on the previous year.
* The prediction for 2016 (based on October 2016’s trade figures) is that exports will continue to increase and could reach £1.12b.
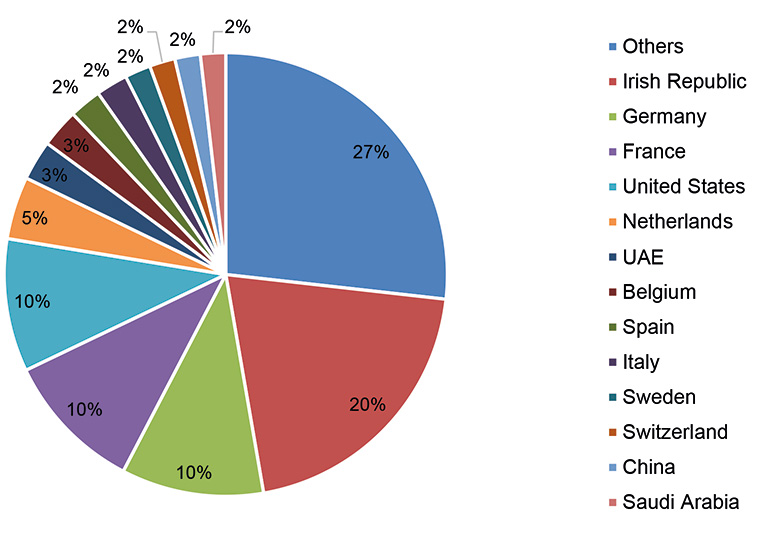
* Exports to the Republic of Ireland have increased significantly over recent years. In 2015, it received 20% of all furniture exports, compared with 19% the previous year, and 17% the year before that. This equated to £205m in 2015.
“The RoI has always been the favoured export market,” says Peter,“but, in real terms, we need to put this in context – total exports were a little over £200m (£25m up on the previous year) – which is small compared to the total UK manufacturing turnover of £8b.
“I couldn’t put this down to a decline in manufacturing in RoI, as they also exported more to the UK in 2015 than in 2014 – thus the trade gap remained similar, at around £140m for both years.”
* Whilst the UK has traditionally targeted its exports at the Irish Republic and the US, the US, France and Germany were each recipients of 10% of UK furniture exports.
* Trade with leading European nations continued to be the other main source of export income, and the main trade destinations were similar to those in 2014. Exports to the EC totalled £630m in 2015, an increase of £99m, with Germany, France, The Netherlands, Belgium, Spain and Italy being the primary recipients.
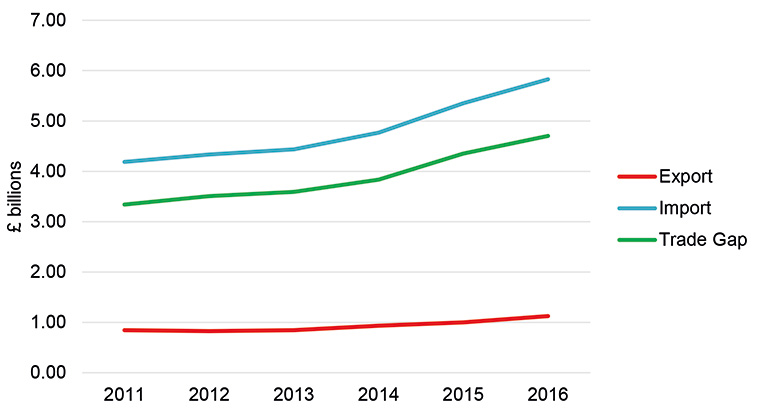
UK furniture trade figures 2011 to 2016, based on an extrapolation of the latest set of results up to, and including, October 2016
* The negative trade gap continued to widen, with increases in imports outstripping any small increases in exports. It reached £4.4b in 2015 and could exceed £4.7b by the end of 2016.
“Twelve months ago the digest flagged a worrying trend of an ever-widening trade gap between import and export data, and this trend has continued,” says Peter. “2015 saw imports of furniture into the UK increasing to almost £5.4b, compared with the 2014 figure of £4.8b. Notably, the prediction for 2016, based on October 2016 trade data to date, is that this figure could reach £5.8b – a £1b increase in just 24 months.”
* Whilst exports to European countries are a positive asset, the reality is that many of these countries continued to export more to the UK than vice versa. This status, along with that for many other products, will impact on any Brexit-associated trade negotiations.
* The main positive trade gap, as in previous years, was with the Republic of Ireland. This gap was £141m. However, whilst exports increased by £31m over the year, these were cancelled out by imports to the same value.
* After this there was a number of countries with which the UK benefited from much smaller positive trade gaps in 2015, starting with the UAE and the US at £22m, followed by Saudi Arabia at £18m.
“The latest figures provide some cause for optimism,” concludes Peter. “A YoY manufacturing turnover increase from 2014 to 2015 of 7%, proceeded by a similar prospective percentage increase from 2015 to 2016, is good news in anyone’s book, and furniture appears to be outperforming many other manufacturing sectors in percentage growth terms.
“Uncertainties over the impact of Brexit make it harder to predict how the industry will fare over the next few years."
"Suffice to say, Europe is a net exporter of furniture to the UK (as it is for many other manufactured items) and I would have thought that it would be in its own interests to ensure that beneficial trade arrangements are in place.
“Should this happen, then the impact on exports would also probably be minimal. However, there are many other financial implications of Brexit which may filter down to consumers and the disposable income in their pockets, and I don’t know how this will pan out.
“I’ll certainly be watching with keen interest, and the Furniture Industry Research Association will continue to support members, and the wider furniture industry, through our knowledge, information and research.”
All findings and summaries in this article are subject to copyright, being issued by FIRA International, the exclusive service provider to the Furniture Industry Research Association.